Map Performance
Explore your performance across every competitive map. Discover where you perform best through combat, consistency, impact and clutch statistics.
Highest Avg Kills
20.9
Best on
Train
Highest ADR
101.3
Best on
Vertigo
Best K/D
1.51
Best on
Vertigo
Best K/R
0.96
Best on
Vertigo

Nuke
Win rate
74%
Kills
17.95
HS%
52%
K/D
1.33
K/R
0.84
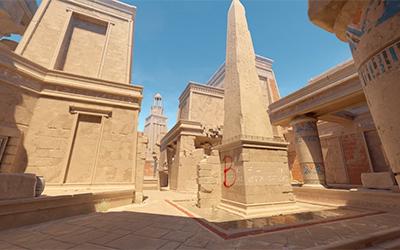

Anubis
Win rate
48%
Kills
16.97
HS%
48%
K/D
1.12
K/R
0.78
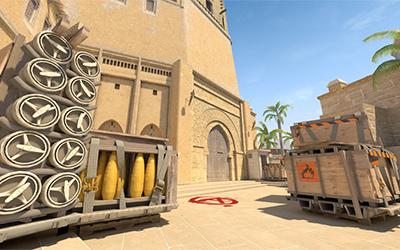

Mirage
Win rate
55%
Kills
17.82
HS%
50%
K/D
1.28
K/R
0.82
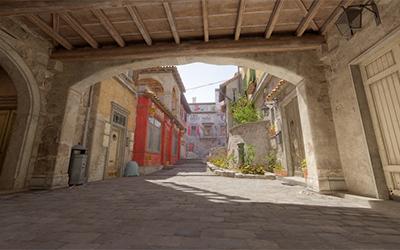

Inferno
Win rate
50%
Kills
16.05
HS%
54%
K/D
1.11
K/R
0.75


Overpass
Win rate
55%
Kills
18.12
HS%
47%
K/D
1.17
K/R
0.8
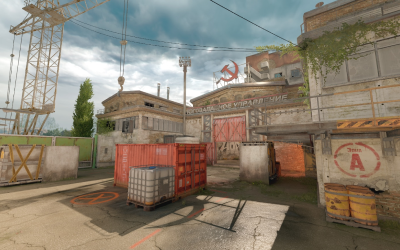
Cache
Win rate
55%
Kills
16.79
HS%
52%
K/D
1.26
K/R
0.81
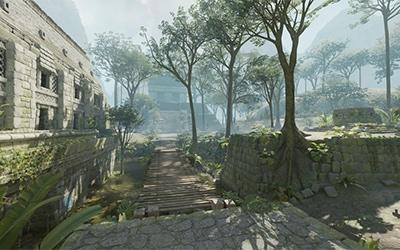

Ancient
Win rate
35%
Kills
18.35
HS%
52%
K/D
1.09
K/R
0.77
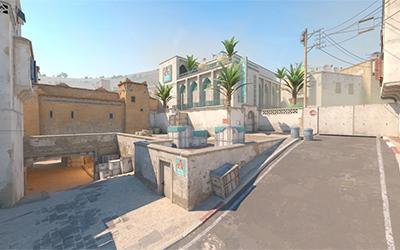

Dust2
Win rate
35%
Kills
17.45
HS%
50%
K/D
1.22
K/R
0.79
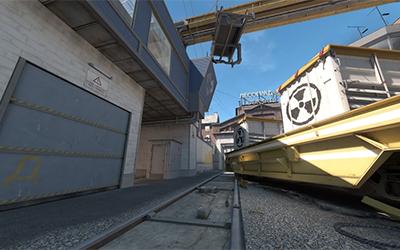

Train
Win rate
53%
Kills
20.94
HS%
54%
K/D
1.2
K/R
0.86
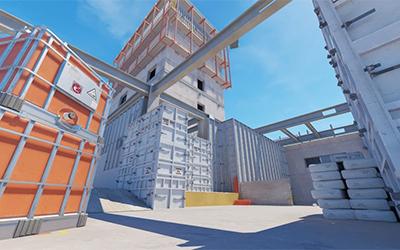

Vertigo
Win rate
33%
Kills
17.33
HS%
39%
K/D
1.51
K/R
0.96
Explore your performance across every competitive map
Map
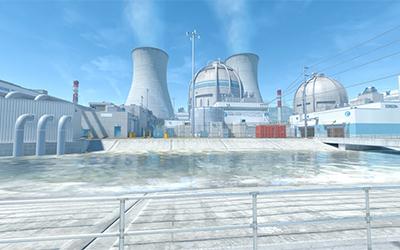
Pulse Score
Competitive Map
Nuke
Pulse Score
Exceptional performance
You're consistently producing high-level impact on this map across multiple areas of your game.
Matches
93
Win Rate
74%
K/D
1.33
ADR
90
Why this score?
How your map performance contributes to Pulse
K/D
15% weight
100 pts
ADR
15% weight
90 pts
Kills
10% weight
90 pts
Entry
12% weight
93 pts
Flash
8% weight
100 pts
Utility Success
8% weight
100 pts
Utility Damage
8% weight
100 pts
Utility Damage Success
6% weight
91 pts
1v1
10% weight
100 pts
1v2
8% weight
90 pts
Map Snapshot
The core numbers behind your performance
Win Rate
74%
K/D
1.33
ADR
90.3
Avg Kills
17.9
Map Identity
K/D
Your ability to consistently win engagements is a major part of your success on Nuke.
Best Metric
1.33
Combat
Mechanical output and damage production
Kills
1669
Avg 17.95 / game
Deaths
1341
K/D 1.33
Damage
90.25
Average damage / round
K/R
0.84
Headshots
52%
AWP Kills
259
Triple Kills
109
Impact
Opening duels and multi-kill potential
Entry Rate
Frequency of opening duel attempts
Entry Success
Opening duels converted successfully
Quad Kills
Four-kill rounds
Penta Kills
Five-kill rounds
Utility
Value generated through utility usage
Utility Success
40%
Flash Success
58%
Utility Damage
10126
Used
931
Damage / Round
5.07
Flashes
749
Enemies Flashed
665
Clutch
Performance in isolated late-round situations
Clutch Situation
1v1
48%
Win Rate
21 successful clutches
Clutch Situation
1v2
27%
Win Rate
16 successful clutches
Final Assessment
One of your strongest competitive maps.
Matches
93
Win Rate
74%

